Poverty :
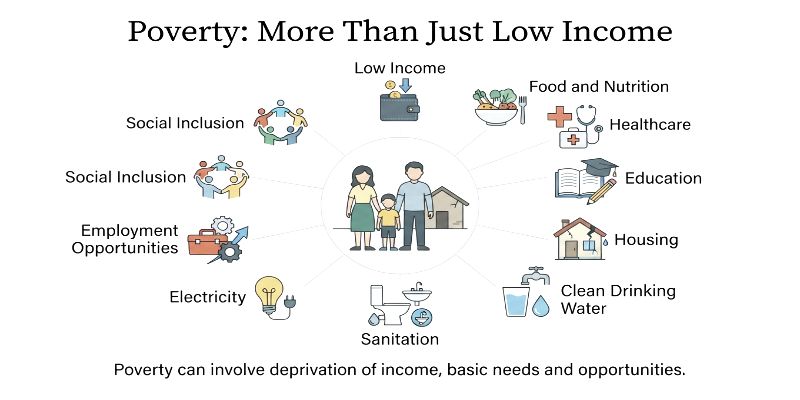
Poverty can be described as a state of a person that lacks resources and opportunities to attain minimal living standards. Poverty is a result of socio-economic development. The notion of poverty does not cover only the lack of financial means because it may include the lack of such basic necessities as nutrition, health care, education, accommodation, drinking water, sanitation, electricity, and gas, as well as job opportunities, and socio-economic integration. As defined by the World Bank, poverty involves a state of significant deprivation of well-being, including not only low income but inability to earn an adequate living. there are two types of poverty named as Absolute poverty and Relative Poverty.
Absolute Poverty
Absolute poverty describes a situation where people or families do not have sufficient resources for a basic standard of living. Basic necessities that people do not have include food, proper shelter, drinking water, sanitation facilities, medical services, and education. The specific resource or service that people lack will determine the lack. The thing that people lack is measured relative to the person’s or family’s income or expenditure compared to the poverty line. The poverty line can be defined using different criteria.
When poverty is absolute, the deprivation is linked to a person’s or family’s inability to attain the basic standard of living.
Relative Poverty
Relative poverty occurs in cases where the person has fewer resources or standard of living in comparison to the existing norm in that particular society. The person who has a certain amount of resources or standard of living may experience relative poverty in cases where his/her standard is way below the average standard in the larger society. The relative poverty is mostly assessed using percentages of the income of consumption distribution of a particular society which is usually median income.
It involves the assessment of the person in relation to the rest of the society. The threshold of this poverty is not fixed as it keeps on changing along with the economic changes in that society.
Lorenz Curve
Lorenz curve is the graphical representation that is applied for depicting the income or wealth distribution among the specific population as well as the distribution of any other quantity among the population. The Lorenz curves are built by means of plotting the cumulative percentage of the population along the horizontal axis and the cumulative percentage of the population's income or wealth on the vertical axis.
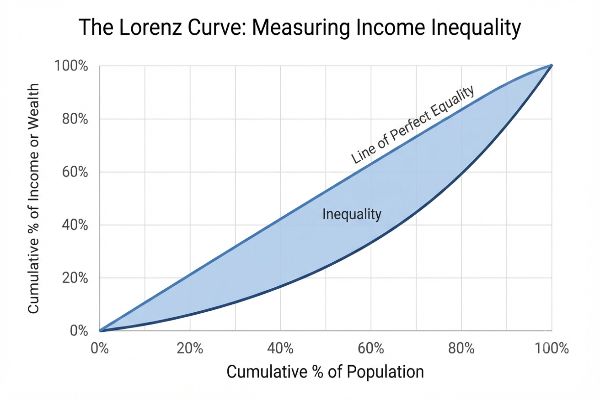
Therefore, in all Lorenz curves the horizontal axis stands for the number of percent of the population while the vertical axis stands for the number of percent of income or wealth. In the simplest case the 45-degree line is depicted on the coordinate system that reflects the absolute equality. Lorenz curves depict the extent of the deviation from the absolute equality of the given distribution; thus, the farther the curve lies from the diagonal, the greater inequality it shows. Lorenz curve is called after the name of American economist Max O. Lorenz who developed the diagram in 1905.
Gini Coefficient
The Gini index (Coefficient) is one of the most popular methods of measuring income or wealth inequality. The Gini index is derived from the Lorenz curve that displays the degree of equality/inequality of income/wealth distribution.
The Gini index usually varies from 0 to 1:
0 – means complete equality,
1 – means complete inequality.
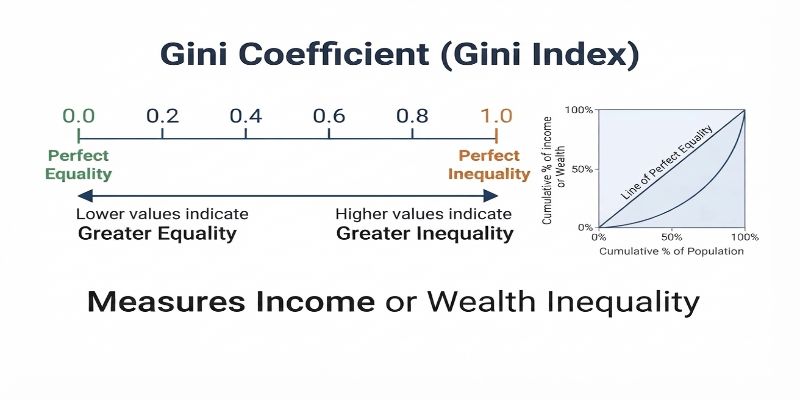
Hence, the Gini index value close to 1 suggests the existence of considerable inequality in the distribution of income or wealth, while the Gini index value close to 0 implies a balanced distribution of income or wealth.remember that gini Coefficient 0 is an imaginary value and not possible or exist anywhere.
It should be noted that the Gini index measures inequality, but not poverty.
Type Of Poverty:
1. Situational Poverty
Situationally poor people refer to those whose incomes are decreased due to an unexpected event in their lives, such as job loss, natural calamity, illness, family troubles, or economic changes.
2. Generational Poverty
Generational poverty stands for poverty that is transmitted from one generation to the other. The causes of this include poor access to education and health services, low level of housing, less employment opportunities, less productive assets, and social and economic exclusion.
3. Rural Poverty
Agricultural dependence, seasonal work, lack of jobs in other sectors, low productivity, poor market access, poor infrastructure, and lack of access to health and education facilities.
4. Urban Poverty
Urban poverty is defined as poverty affecting individuals who live in urban areas. It may include insufficient housing, overcrowding, lack of access to essential services, informal jobs, insecure earnings, lack of health care and education, poor sanitation, among others.
5. Multidimensional Poverty
Multidimensional poverty refers to the concept that poverty entails not only the lack of money or income but that there are other things one may be deprived of as well. For example, one can be deprived of good nutrition, proper education and health facilities, sanitation, clean fuel and electricity, a proper house, clean drinking water, and much more.
Multidimensional Poverty Index
The Multidimensional Poverty Index (MPI) reflects the extent to which people experience deprivations in different aspects of human development. The index was designed by the United Nations Development Program (UNDP) and the Oxford Poverty and Human Development Initiative (OPHI). The Global MPI is an indicator of acute multidimensional poverty that includes three dimensions and ten indicators;
1. Health
2. Education
3 .Standard of Living.

A person is said to be multidimensionally poor if their weighted deprivation score is at least 1/3, or 33.3% and score of 1/2, or 50%, or more indicates an extremely multidimensionally poor individual.
Multidimensional Poverty in India
(In India has its own Multidimensional Poverty Index (MPI), which was created by NITI Aayog for India.)
According to NITI Aayog, multidimensional poverty has decreased from 24.85 percent in 2015-16 to 14.96 percent in 2019-21 and is predicted to be 11.28 percent in 2022-23. NITI Aayog estimated that around Around 25 crore people came out of multidimensional poverty during the years of 2013-14 to 2022-23.
Note : The National MPI of India and Global MPI cannot be compared due to different indicators and methodology.
Measuring Poverty in India (traditionally)
India has traditionally measured monetary poverty based on consumption expenditure rather than household income. This was preferred to because income can be volatile, a household can have different sources of income, and it can be challenging to report income. Consumption expenditure can help determine the level of living more accurately.
Note : Historically, poverty was measured by comparing the per-capita consumption expenditure with a poverty line.
Early Poverty Estimates in India
Let’s take a quick look at early poverty estimations.

Dadabhai Naoroji – 1901
Dadabhai Naoroji was one of the first people to systematically calculate the amount of poverty in British India. He studied the low income and living standards of Indians and associated this with the wealth drain from the country. His ideas were expressed in his famous book Poverty and Un-British Rule in India.
National Planning Committee – 1938
National Planning Committee was formed in 1938, under the leadership of Jawaharlal Nehru, to study various aspects of economic planning and development in India. In addition, this committee was also focused on investigating the minimum level of living that needs to be maintained in the country.
Bombay Plan – 1944
The Bombay Plan was an economic development plan formulated in 1944 by a group of prominent industrialists in India. The Bombay Plan emphasized the economic development of India after independence and called for government intervention in terms of investment and planning. This is significant in the history of Indian economic planning, but it was not a government-appointed committee to estimate poverty or fix the poverty line.
Planning Commission Working Group – 1962
A Working Group was formed in 1962 to study questions of poverty and minimum consumption requirements in India. Early estimates are available for rural and urban areas, using 1960–61 prices. note that these numbers may not directly relate to current rupee poverty thresholds.
Dandekar and Rath – 1971
V. M. Dandekar and N. Rath carried out an important research on poverty by using the National Sample Survey data. Their main contribution consisted of analyzing the consumption expenditure and calorie requirements, which led to the poverty-line estimation in India.
Alagh Task Force – 1979
The Task Force on Projections of Minimum Needs and Effective Consumption Demand was Headed by Y. K. Alagh. It set out to define the poverty line based on calorie content.
That is,
Rural: 2,400 kcal/person/day
Urban: 2,100 kcal/person/day
The level of consumption was determined according to the prices of 1973–74.
Lakdawala Committee – 1993
The Expert Group on Estimation of Proportion and Number of Poor was headed by D. T. Lakdawala. It adopted state-wise poverty lines and made adjustments for price variations across the states. The approach relied on consumption expenditures.
The method used by the Lakdawala Committee was subsequently superseded by the method of Tendulkar.
Tendulkar Committee – 2009
The Expert Group to Review the Methodology for Estimation of Poverty was constituted under the chairmanship of Suresh D. Tendulkar and submitted its report in 2009. The committee departed from the norm of using calorie consumption as a criterion of poverty estimation and focused more on overall consumption expenditure, including expenditure on health and education.
The poverty lines for 2011-12 according to Tendulkar Committee are:
Rural: ₹816 per person per month
Urban: ₹1,000 per person per month
These are poverty lines as of the period 2011-12 and should not be considered as cut-offs for present-day estimates of poverty.
Rangarajan Committee – 2014
This Committee was headed by C. Rangarajan and released its report in 2014. It suggested different poverty baskets in respect of food and non-food essentials for rural and urban poor like clothing, housing, education, and transport.
Based on 2011–12 price levels, it suggested:
Rural: ₹972 per capita per month
Urban: ₹1,407 per capita per month
This was only a recommendation of the committee and it was not implemented as the new method for measuring poverty.
Poverty Gap

The poverty gap reflects the distance between the poor and the poverty line. The higher the poverty gap, the greater the distance of the poor from the poverty line.
For eg, if the poverty line is ₹1,000 and the consumption of the poor is ₹700, the poverty gap will be ₹300.
Latest World Bank Poverty Line
In June 2025, the World Bank announced its latest international poverty lines, measured in 2021 Purchasing Power Parities (PPPs):

Note that these are international-dollar amounts, and should not be directly converted into Indian rupees using the market exchange rate
India's World Bank Poverty Estimate
Using India's 2022-23 consumption data, the World Bank estimated extreme poverty at 2.3% using the old $2.15 per day poverty line based on 2017 PPPs.
In June 2025 the World Bank updated the international extreme poverty line to $3.00 per day using 2021 PPPs. Using this new line, India's extreme poverty rate for 2022-23 is estimated at 5.3%.
Poverty Alleviation
Poverty reduction strategies are actions and measures designed to reduce poverty and enhance the quality of life of individuals.
For examples include job creation, skills development, education, healthcare, rural development, access to finance, social security, housing, food security, infrastructure development, sanitation, and protection of the vulnerable groups. Hence, the process of poverty reduction entails much more than just raising income levels.
Login with